Only 25% of AI projects meet ROI expectations in 2026. Most deliver 1-5% returns. Decision-makers face pressure to justify spends amid mixed results.
You need solid ROI metrics and business cases. They cut waste. They prove real value. This post breaks down core metrics, case-building steps, and fresh trends. You'll spot profitable paths fast.
Unlock the Power of Essential ROI Metrics That Drive Real Profits
Core metrics reveal truth. Forget vanity stats like likes or traffic. Focus on these. They tie spend to revenue.
Start with ROI. The formula is simple: (Revenue minus Cost) divided by Cost, times 100. Spend $1,000. Gain $3,000. That's 200% ROI. Break-even sits at 0%. Aim higher, like 300% for safety.

These numbers beat impressions. They show cash flow. In 2026, top AI cases hit 551% ROI through tool savings.
Master the Basic ROI Formula in Minutes
Calculate ROI step by step. First, track all costs: tools, staff, ads. Next, measure revenue: sales or savings.
Example: $10,000 campaign cost. $40,000 revenue. Subtract cost: $30,000. Divide by cost: 3. Times 100: 300%. That's a 3:1 ratio.
Set targets upfront. Company goals dictate. Tech firms chase 4:1. Retail settles for 2:1. Zero percent means no gain. Lose money below that.
Tie it to approvals. Show break-even first. Then project upside. Stakeholders nod at clear math.
Why CLV and CAC Are Your Best Friends for Long-Term Wins
CLV totals revenue from one customer. Average $500 yearly spend over three years: $1,500 CLV.
CAC is acquisition cost. Sales team plus ads: $300 per customer. LTV-CAC ratio: 5:1 ideal. Below 3:1 spells trouble.
For 2026 benchmarks, check CAC data by industry and stage. SaaS medians hit $2 per $1 ARR. AI cuts those costs 30-47%.
These metrics ensure sustainability. High CAC kills margins. Strong CLV funds growth. Balance them for efficiency.
Track Conversion Rates and Churn to Cut Waste
Conversion rate: leads to buyers. 2% means 100 leads yield two sales. Boost it with better targeting.
Churn rate: customers lost monthly. 5% hurts. Retention flips that: keep 95%. Link to revenue per user.
Low conversions signal bad leads. High churn points to poor service. Fix both. Watch revenue climb.
In 2026, AI personalization lifts these. It predicts churn early. Result: steadier profits.
Build Business Cases That Get Green Lights Every Time
Metrics alone won't sell. Build cases around goals. Align to revenue. Use gross profit math.
Split budget: 70% proven channels. 20% tests. 10% experiments. Map stages: lead to sale.
Prove with data. One AI layer saved $3.4 million. Cut overlaps 44%. That's hard evidence.
Set Break-Even and Target ROI Up Front
Define zero ROI first. Match costs to baseline revenue. Then set targets: 200-400%.
Link to company aims. Growth phase? Push 300%. Stability? 150% suffices.
Document assumptions. Traffic sources. Conversion lifts. Finance teams approve fast.
For AI examples, see this business case on ROI and timelines. It stresses pre-launch rigor.
Pick Revenue-Focused KPIs Over Vanity Stats
Choose sales conversions. Repeat buys. Average order value. Cost per lead. Traffic to lead rate.
Skip page views. They mislead. Dashboards track trends. Spot drops early.
Revenue KPIs predict cash. Vanity ones distract. Stick to what pays.
| KPI | Why It Matters | 2026 Example |
|---|---|---|
| Sales Conversion | Leads to revenue | 3-5% target |
| Repeat Buy Rate | Builds CLV | 25%+ yearly |
| AOV | Boosts per sale | $150 average |
| Cost Per Lead | Controls CAC | Under $50 |
This table shows priorities. Use it for quick scans. Focus lifts ROI.
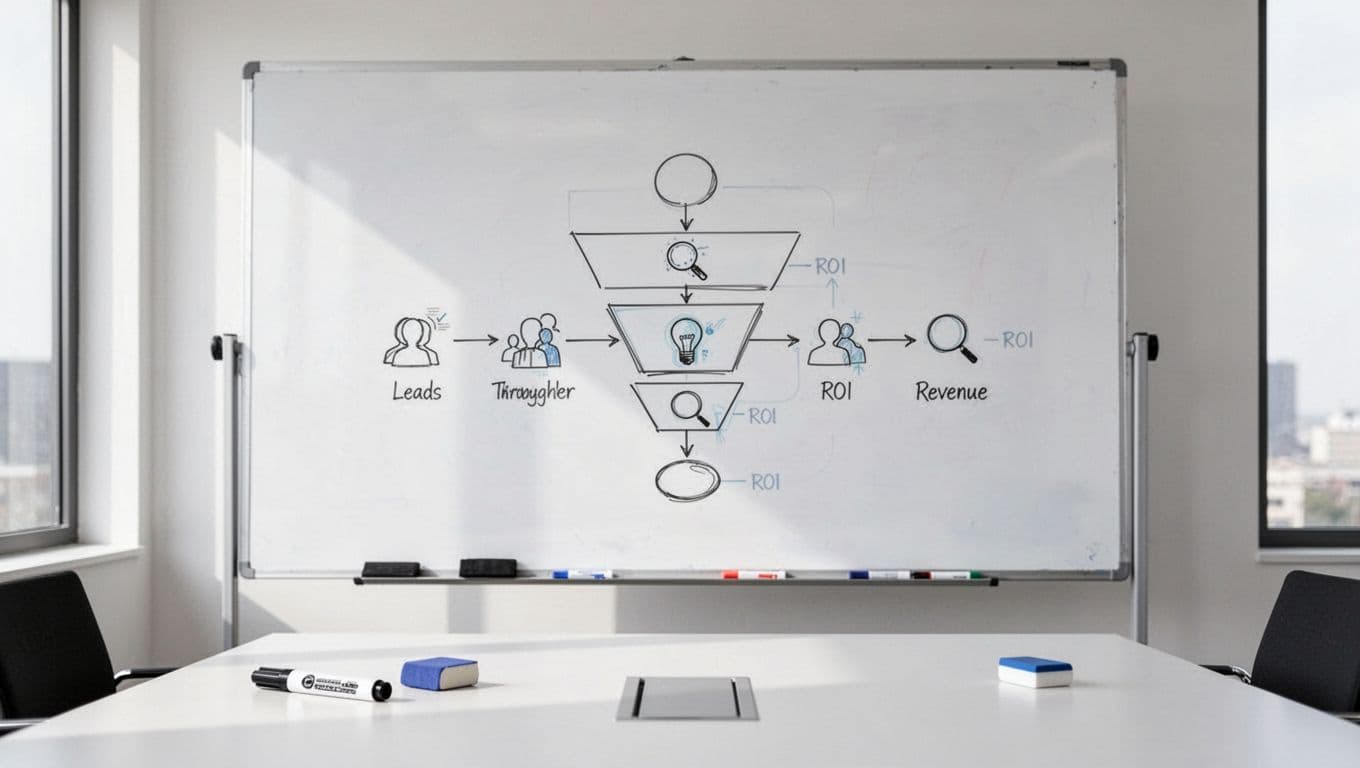
Prove It with Stages and Real Data
Map the funnel. Leads enter. Some convert. Others drop. Find weak spots: low mobile rates.
Channel ROI varies. Influencers hit 5:1 in tests. Email leads pack. Track per stage.
Real data wins. 551% from AI tools. $3.4M savings. Numbers silence doubt.
Stages reveal friction. Fix them. Cases close.
Stay Ahead with 2026 KPIs and Trends for Smarter Decisions
Timeframes matter. Check daily spends. Weekly rates. Monthly full ROI.
AI speeds ROI 28% in top marketing. Email tops returns. Behavioral segments sharpen targets.
New retail metrics: loyalty scores. Device splits. Funnel depth.
Future-proof cases. Adapt or lag.
Daily, Weekly, and Monthly Checks That Matter
Daily: spend versus conversions. Spot overruns.
Weekly: rates and costs. Trends emerge.
Monthly: full ROI. Benchmark against goals. Dashboards automate.
Consistency catches issues. Adjust real-time.
Hot 2026 Shifts: AI, Email, and Beyond
AI hits 83% clear ROI in marketing. Organic traffic up 120%. Content output jumps 42%.
Email personalization drives sales. Retention channels cut churn.
Influencer ROI holds at 5:1 plus. Shift from sales volume to efficiency.
For LTV:CAC insights, review SaaS benchmarks including churn. NRR at 101%. Payback in 20 months.
Track these. Cases strengthen.
Master these ROI metrics. Build tight business cases. Watch 2026 trends.
Calculate one ROI today. Audit your KPIs now. Better decisions fuel growth. You control the outcomes.